Bucket Basics
You can create a static bucket to group numeric values into meaningful categories without changing underlying data or requiring developer support.
Overview
Buckets let you create new columns in a dataset where raw values are grouped into categories defined by end users, avoiding the need to involve developers or database architects. Buckets behave like other columns in the dataset, and you can use them in charts, metrics, and filters that are part of the same dataset.
Bucket Tutorial
The following tutorial video shows how to create simple buckets with fixed (static) values.
Tags: Chart, Bucket, Column
Usage
Static buckets are most useful when the ranges and labels you need do not depend on other columns or changing logic. They are ideal for grouping numeric measures into simple, static categories such as low, adequate, and sufficient.
Create a Static Bucket
-
Open a dataset and go to the Analyze tab.
In tabular view, you can see the raw data available for use in the bucket.
-
Add a new bucketed column by selecting the Bucket icon. When the Buckets dialog opens, select Add Bucketed Column.
-
From the Column to Bucket dropdown, select a source column.

-
Review the generated buckets, and change the bucket type and count as needed.
For numeric data, the system automatically generates 10 buckets that divide the data into equal ranges.
To generate a different number of buckets, change the Value Type from Dynamic to Fixed, then define the number of buckets that suits your value ranges. The system adjusts the minimum and maximum values of your ranges to distribute them equally between buckets.
-
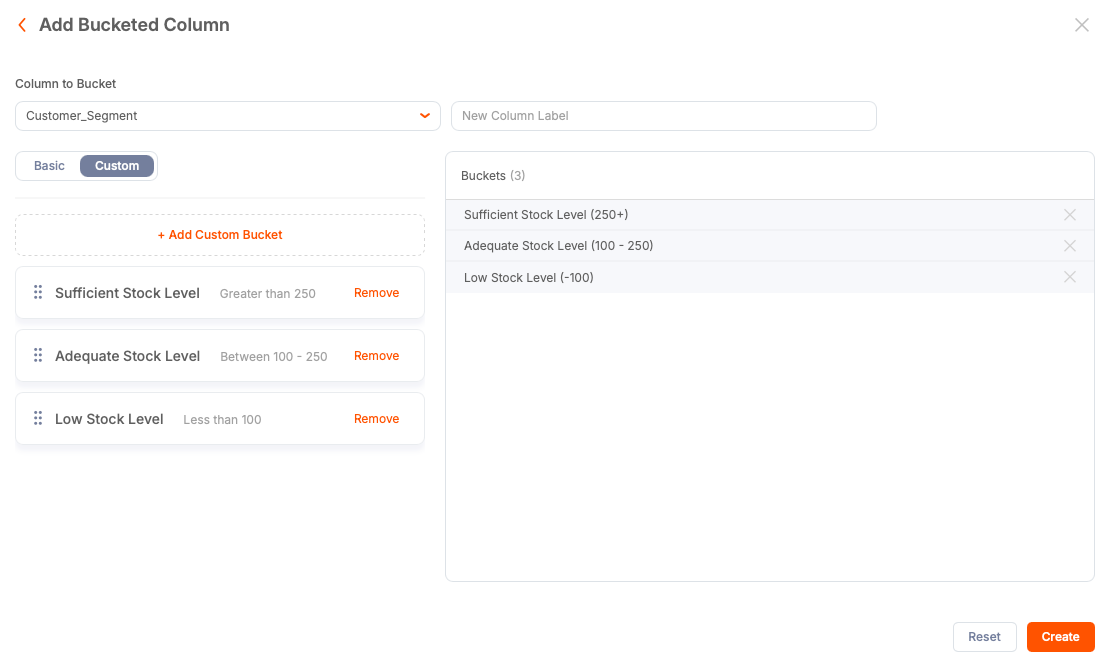
(Optional) To set your own value ranges and labels, change from Basic to Custom.
Example labels and ranges:
- Sufficient stock level: anything greater than 250.
- Adequate stock level: anything between 100 and 250.
- Low stock level: anything less than 100.
Changes to bucket definitions (ranges or labels) immediately affect each chart and metric that references that bucket.
-
In the New Column Label field, enter a display label for the bucket column.
-
Select Create to make the new column available for use. Buckets are bound to the dataset where they are created. You can use them in any chart or metric that references the same dataset.
Bucket Use in Charts
Bucket output is most often text. As a result, the new bucket is typically available in the Categories list when building charts. If you define a numeric output for your bucket, it displays in the Values list.
Best Practices
- Define an appropriate number of buckets. Too many can confuse users, while too few can hide meaningful distinctions.
- Use clear, descriptive labels to provide clarity to the consumers of a chart.
- If multiple people rely on a bucket, document the bucket rules.
- Changes to bucket definitions (ranges or labels) immediately affect each chart and metric that references that bucket.
Additional Resources
- When ranges need to depend on other columns or changing logic, use formulas to create dynamic buckets. For more information, see Dynamic Buckets.