Chart Builder
Use the Chart Builder to create charts and metrics based on your data.
Chart Builder Layout
The Chart Builder includes several key components:
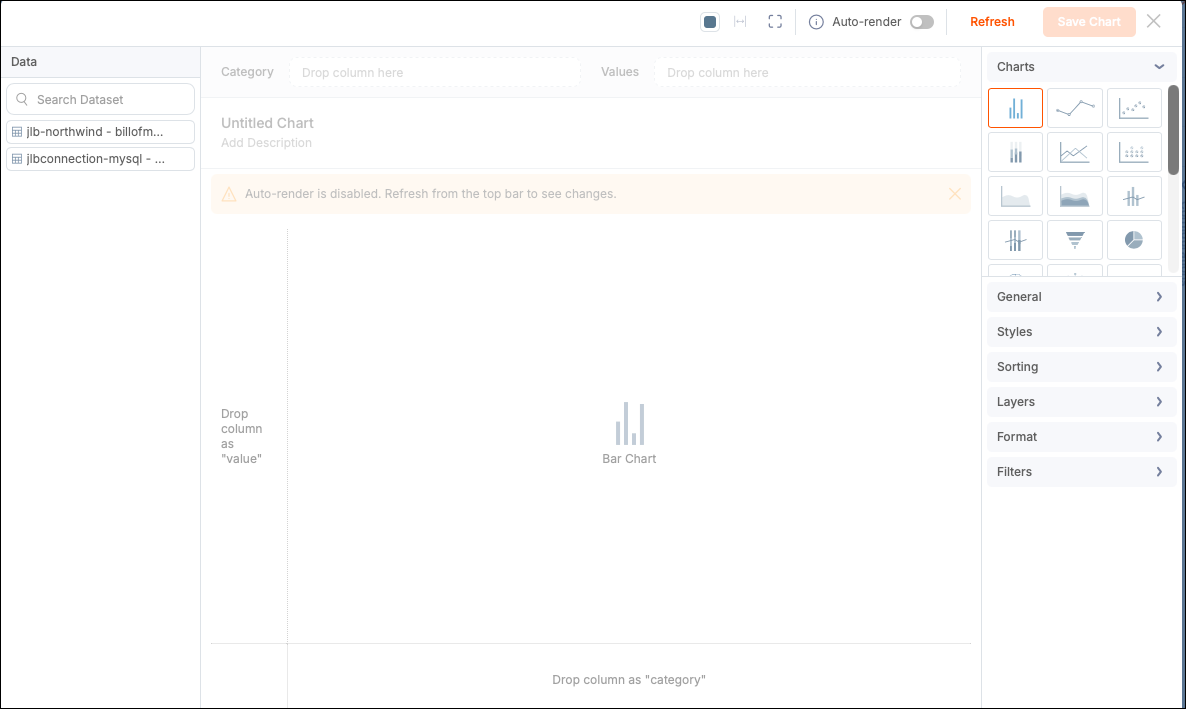
Data Panel
Select a dataset from this panel to display its data fields, divided into Categories (text/date columns for grouping) and Values (numeric columns for measures). The panel also lists aggregate formulas for use inside charts as columns. For more information, see Aggregate Formulas.
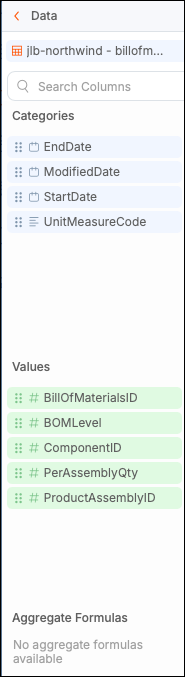
Column Shelf
Drag fields (column pills) to the Column shelf for analysis. Each column pill offers formatting, aggregation, and sorting options. Depending on the chart type, you can also add dimensions.

Toolbar
The following items are available in the toolbar:

| Tool | Description |
|---|---|
| Show Labels | Select Show Default Labels or Show Internationalization Labels to change the label display. |
| Buckets | Groups multiple data points into a single item. For more information, see Buckets. |
| Formulas | Opens the Formula Builder to create new columns of data that do not already exist in the dataset. For more information, see Formulas. |
| Filters | While building your chart, you can create and apply internal filters to its data. For more information, see Filters. |
| Chart Colors | Selects a color palette for the elements displayed in the chart. |
| Fit to Panel | Fits the chart into the panel when scrolling is required by the display. You can enable the Fit to Panel option in the Self-service Options area of the chart configuration panel. |
| Full‑Screen View | Enters full-screen mode while editing the chart. |
| Auto-Render | As you make changes, results update instantly. When disabled (default), the toolbar displays a Refresh button to apply and display changes on demand. This prevents unnecessary data requests and reloads of the chart inside the Chart Builder. |
| Save Chart | Saves your chart settings. You can save updates as a new chart. |
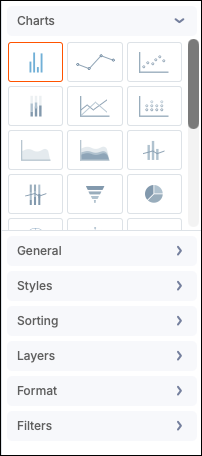
Configuration Panel
Select a chart type and customize chart-specific styles.
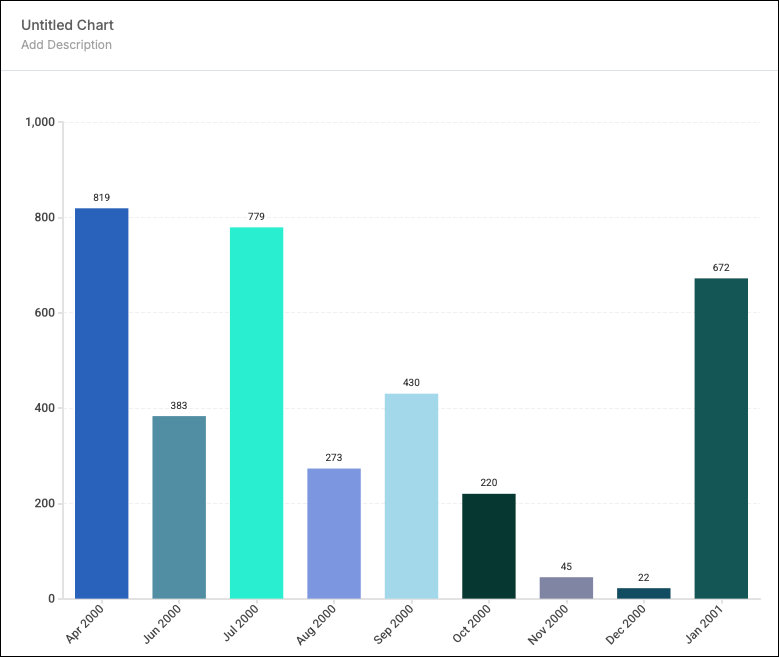
Canvas
View your chart and edit its name or description.
Build a Chart
-
Add a chart from the Analyze section of the dataset or directly to the dashboard.
-
Select a dataset for your chart. If you start from the Analyze section, the dataset is preselected.
-
Add data fields by dragging fields from the Data panel to the Column shelf or directly onto the canvas.
- Category fields are grouped using a Count function.
- Value fields are aggregated using a Sum function.
- Adjust aggregations, sorting, and formatting using the column pill menu.
-
Use the Configuration panel to customize your chart by adding styles, legends, tooltips, data labels, and axis labels.
-
Add a name and optional description, then select Save Chart.
After saving, your chart appears as a panel. You can access the panel from the Analyze view or from the existing charts list under the dataset in the dashboard.
Manage and Edit Charts
When enabled, the following options are available within a chart panel:
-
Smart Analyzer - Opens the Smart Analyzer chatbot.
-
Filters - Set or edit panel filters.
-
Options (three-dot) menu - Provides the following tasks:
- Edit the chart.
- Download, duplicate, or delete the chart.
- Embed the chart.
Create AI-Generated Charts (Beta)
You can generate charts using a descriptive prompt with AI.
Note: You must enable and configure AI under Admin > Customization > Features > AI.
Create an AI Chart in a Dashboard
- Select Insert Chart > Create Chart with AI.
- Enter a prompt and generate your chart.
- Select Add chart to dataset and dashboard.
Create an AI Chart in a Dataset (Analyze > Custom View)
- Select Create Chart with AI.
- Enter a prompt and generate your chart.
- Select Add chart to dataset.