Comparative Analysis
Use Comparative Analysis to compare aggregated values in a grouped table chart across different date periods.
Overview
Comparative Analysis is available only for grouped table charts that contain at least one date column in their dataset and at least one aggregated column in the table.
Reference values, comparison values, and their differences are displayed in separate columns, making it easier to analyze change over time directly within the chart.
Comparison Modes
Comparative Analysis supports the following modes:
-
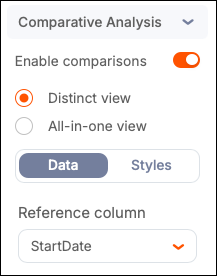
Distinct view — A comparison experience that displays reference, comparison, and difference values in separate columns. By default, this view applies to new charts and existing charts without a previous comparison configured.
-
All-in-one view — Legacy comparison experience selected by default for existing charts that already have a comparison configured. The date column, time period, comparison criteria, and other settings continue to work as previously configured.
Comparison Groups
In Distinct view, a comparison group is a set of columns derived from a single aggregated column:
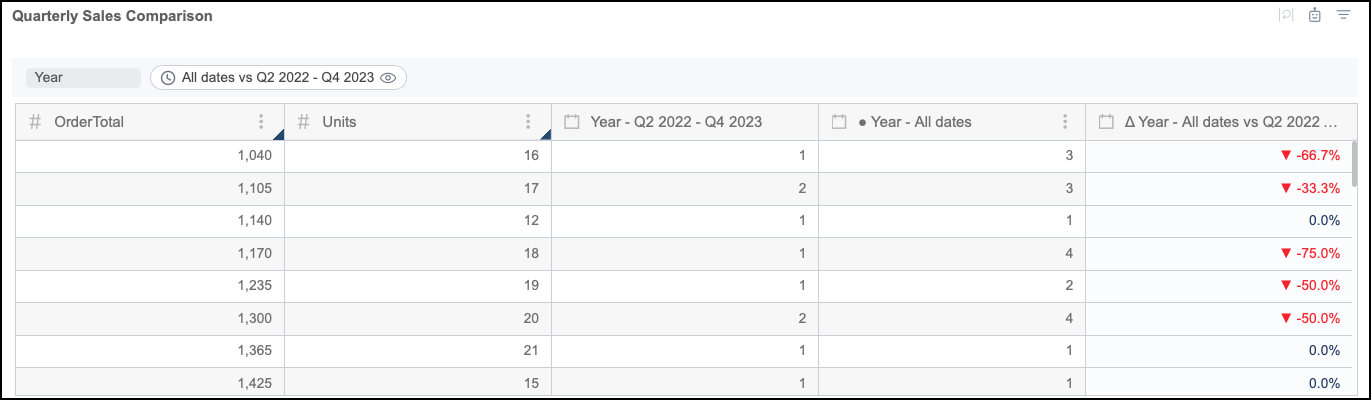
- Reference column — The aggregated column filtered by the reference date period. A visual indicator is displayed in the column header (Year - All Dates).
- Comparison column — The same aggregated column filtered by the comparison date period (Year - Q2 2022-Q4 2023).
- Difference column — The calculated difference between the reference and comparison values (Year - All dates vs - Q2 2022 - Q4 2023).

You can create a comparison group for each aggregated column in the table. All groups are calculated using the same reference and comparison criteria.
Difference Calculations
| Type | Formula |
|---|---|
| Absolute change | Comparison value − Reference value |
| Percentage change | (Comparison − Reference) × 100 ÷ Reference |
Absolute difference values use the same format as the reference column. Percentage values display with one decimal point.
If the reference or comparison period contains a missing value:
- Absolute change is calculated treating the missing value as zero.
- Percentage change is not calculated. Instead, the system displays a Missing label.
Difference Column Indicators
Each difference column can include one or more of the following indicators. The order in which you select them determines their display order from left to right:
- Percentage value —
(Comparison − Reference) × 100 ÷ Reference. - Absolute value — Formatted the same as the reference column.
- Arrow icons — Styled using positive and negative colors.
- Text labels — Configurable for positive, negative, and neutral change.
Styling
You can define colors to represent positive, negative, and neutral change, and configure what positive and negative mean for your data.
Conditional formatting behavior:
- Formatting applied to a reference column cell also applies to the comparison column, but not to the difference column.
- Formatting applied to the row also applies to the difference column, but the difference column style takes precedence when there is a conflict.
Enable Comparative Analysis
Comparative Analysis requires a grouped table chart with at least one date column and at least one aggregated column in the dataset.
-
Open the table chart in the Chart Builder.
-
In the Comparative Analysis section, enable the Enable comparisons toggle.
-
Select a comparison mode:
- Select Distinct view for a new comparison setup.
- Select All-in-one view to use the legacy comparison experience.
To disable Comparative Analysis, turn off the Enable comparisons toggle. The system removes all comparison calculations and returns the table to its original format. The system retains the configuration — if a group is removed from the table and then re-added, the comparison is automatically re-enabled with its previous configuration.
Configure Distinct View
Set Reference and Comparison Columns
When Distinct view is first enabled, the Data tab displays the first aggregated column and the first date column in the dataset as automatic selections for the reference and date columns. An initial comparison group is created with both criteria set to All dates.
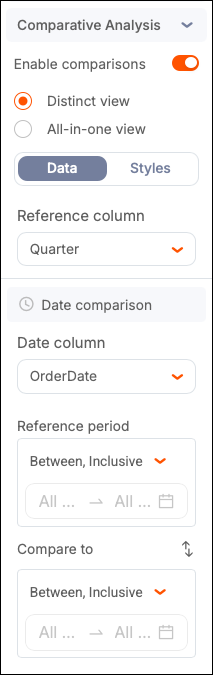
- Under Reference column, select an aggregated column in the table.
- Under Date column, select any date column from the dataset. The column does not need to be present in the table.
- Select time periods for comparison. If (date presets) are configured in the Admin Center, they will be available for selection.
You can modify the selected period and the operator for each criterion.
Configure Difference Columns
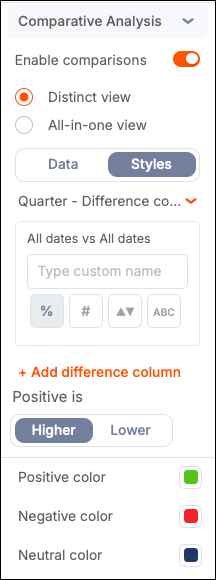
Use the Styles tab to define Difference columns settings. You can configure individual settings for each column:
-
Change the column name.
-
Select a value format:
- Percentage value
- Absolute value
- Up/down arrow icons
- Text labels for positive, negative, and neutral change
-
Select your preference for positive criteria to be higher or lower.
-
Set positive, negative, and neutral colors for values and arrow icons.
Add Comparison Groups
You can add a comparison group for each aggregated column in the table. All groups are calculated using the same reference and comparison criteria.
- Under Reference column, select one or more additional aggregated columns.
- Qrvey creates a separate comparison group for each selected column.
Enable Self-Service Comparative Analysis
Self-service Comparative Analysis allows end users to control comparison criteria from within the published table.
To enable Self-service Comparative Analysis, select the Comparative Analysis checkbox from the Self-service Options section of the Chart Builder.
When enabled, a control is displayed above the table in the published view:
- A pill displaying the reference and comparison criteria.
- An eye icon on the pill for toggling comparison on or off.
End users can perform the following actions when interacting with the pill:
- Select the eye icon to show or hide the comparison columns.
- Change the reference or comparison date criteria using the standard date picker.
Configure All-in-One View
If a previous comparison was configured for the table, all fields are pre-populated with that configuration.
- From the Date column dropdown, select the date column to use for the comparison.
- Updated the Time period and Comparison criteria as needed.
For more information, see the Create Date-Based Comparisons tutorial.